Intro
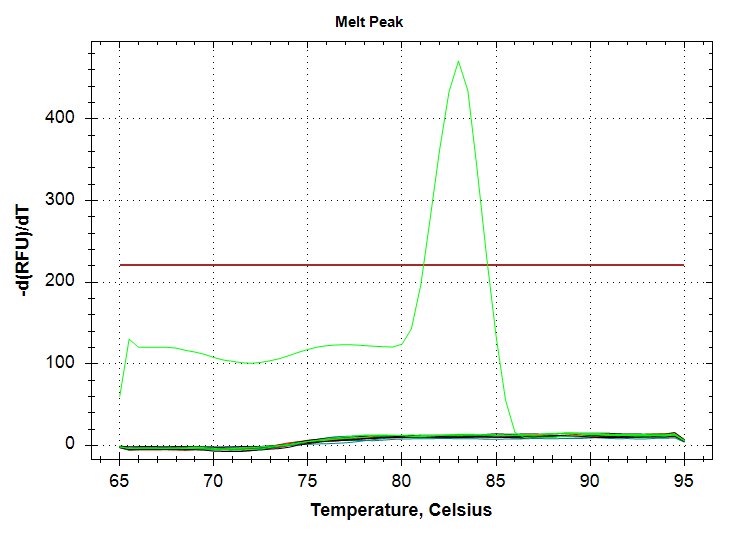
Due to odd results from earlier today (Notebook), I repeated this qPCR to see if I could get better replication and consistent melt curves across samples.
qPCRs
All qPCRs were run in triplicate for each dilution (1000pg, 100pg, 10pg), with SsoAdvanced Universal SYBR Green Supermix (PDF; Bio-Rad) in 20uL reactions. The CAct primers were utilized with an initial “working stock” concentration of 10uM and at a final concentration of 0.25uM in each qPCR reaction.
qPCR calculations
- 20231210-qPCR_calcs (Google Sheet)
Results
Output files
Raw qPCR data (.pcrd; Requires CFX Maestro):
sam_2023-12-10_09-26-24_Connect.pcrd“Analysis Mode” was set to “Target” (“Fluorophore” is the default.)
Baseline threshold was set to “Regression”
qPCR data (CSV):
qPCR Report (PDF):


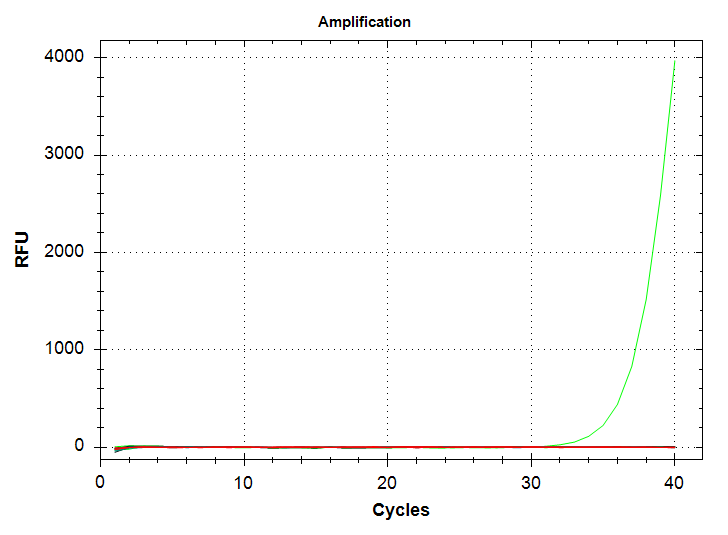
Well, the results are similar to the previous run, in that there’s a single 1000pg replicate which amplifies at a Cq of ~37, while we no longer see amplification in any 100pg replicates. Admittedly, the latter was expected, based on the different melting temp of the 100pg product seen previously; i.e. the previous amplification of 100pg DNA wasn’t “real.”
However, what was not expected was my continued inability to produce proper technical replicates. I’m wondering if the sensitivity of this primer is low enough that it’s causing a large (i.e. ~3 Cq) swing in Cqs between replicates. I’ll repeat this using the 10,000pg (10ng) stock to see if this improves replication…