Intro
Previous qPCR from 20231119 had poor results with the CAct primer set (C symbiont). No amplication at 1000pg, a single sample amplified at 100pg, and no amplification at 10pg of input DNA. I opted to order a replacement of the CAct primer set and repeat the qPCRs using the same serial dilution series and only this new CAct primer set.
qPCRs
All qPCRs were run in triplicate for each dilution (1000pg, 100pg, 10pg), with SsoAdvanced Universal SYBR Green Supermix (PDF; Bio-Rad) in 20uL reactions. The CAct primers were utilized with an initial “working stock” concentration of 10uM and at a final concentration of 0.25uM in each qPCR reaction.
qPCR calculations
- 20231210-qPCR_calcs (Google Sheet)
Results
Output files
Raw qPCR data (.pcrd; Requires CFX Maestro):
sam_2023-12-10_07-50-37_Connect.pcrd)“Analysis Mode” was set to “Target” (“Fluorophore” is the default.)
Baseline threshold was set to “Regression”
qPCR data (CSV):
qPCR Report (PDF):


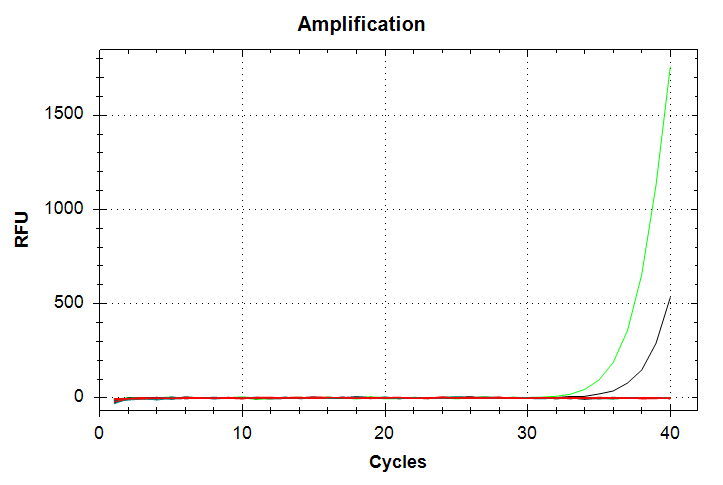
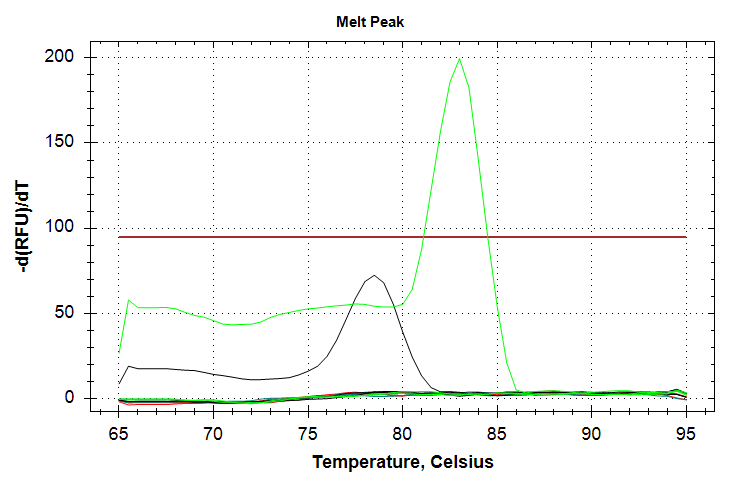
In the above plots, the green line represents 1000pg of input DNA, while the black line represents 100pg of input DNA. Both sets show only a single sample ampifying (1000pg corresponds to a Cq value of ~37. 100pg corresponds to a Cq value of ~39), despite being run in triplicate. Additionally, the melt curves show that the 100pg samples (black peak) doesn’t reach thre threshold and is shifted to a lower temperature than the 1000pg sample. Taken all together, this qPCR should be repeated to try to overcome the poor replication and the odd differences in qPCR products evidenced by the differences in melting temperatures between the 1000pg and 100pg samples.